How to Diagnose VPS Network Problems?
Diagnosing network issues is an essential skill for VPS users. It not only helps you quickly fix disruptions but also prevents them in the future. In the following sections, we’ll walk you through quick, practical, and effective methods to pinpoint the causes of internet connection problems.
Step 1: Pinpoint the Issue - Is It Your Network or the Server?
First, find out if the problem is in your network or on the server.
Try Connecting from a Different Network:
- Switch to a different network (e.g., mobile data instead of Wi-Fi).
- On your smartphone:
a) Turn off Wi-Fi and use mobile data.
b) Download a Remote Desktop (RDP) or SSH client.
c) Attempt to connect to the VPS.
Interpreting the results:
✅ If the connection works on mobile data: the issue is with your current network (home, office, or public Wi-Fi).
❌ If the connection fails on all networks: the issue is likely with the VPS.
Disable VPN Temporarily:
- VPN services can change your network route and may block specific ports used by the VPS connection.
- Turn off the VPN and try connecting to your VPS again.
Step 2: Check Latency and Packet Loss.
Please run network diagnostics not only from inside the VPS itself, but also from your own device. This helps confirm whether issues are local to the VPS or happening across the connection.
1. Open a terminal
- Linux: Connect to your VPS via SSH (for example, ssh root@<IP_address>).
- Windows VPS: Open Command Prompt or PowerShell.
2. Run the ping command
ping <address>
Instead of <address>, you can use:
- IP address or a DNS server (for example, 8.8.8.8 — Google DNS).
- The domain of a specific site (e.g., ping google.com).
3. Analyze the results
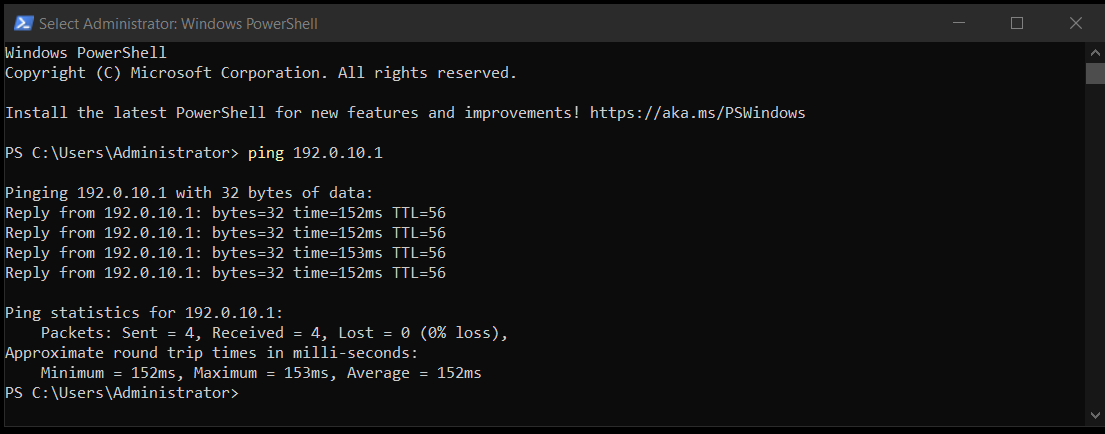
The replies will show the response time (time= in ms). For a stable connection:
- 1–30 ms — excellent latency (within the data center or local region).
- 30–100 ms — normal latency between countries.
- 150+ ms or large fluctuations — possible routing issues or network congestion
4. Use additional parameters
- Linux: Add -c 10 (example: ping -c 10 8.8.8.8) to send 10 packets and stop.
- Windows: Add -n 10 (example: ping -n 10 8.8.8.8).
If latency is high, please contact the PetroSky Support for a detailed investigation.
Step 3: Run a traceroute to pinpoint the source of the slowdown.
- Linux: traceroute 8.8.8.8
- Windows: tracert 8.8.8.8
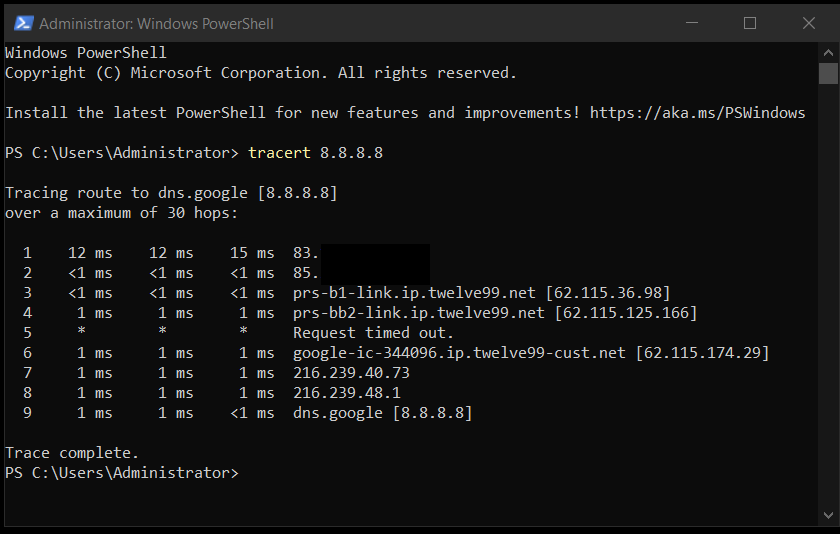
Interpreting the results:
- The first hops show your VPS network path.
- If delays start at the first hop, the issue is likely inside the data center.
- If delays appear further down, it’s an upstream routing problem.
These steps make it easier to see whether the problem lies with your own setup, the data center, or somewhere in between, and help you decide on the most effective next action - whether that’s adjusting your local configuration, contacting your ISP, or reaching out to PetroSky Support for further analysis.
Thank you for choosing PetroSky!


